Difference between revisions of "STIX Data Center Figures: STIX Quick-look data browser"
| Line 6: | Line 6: | ||
[[File:Stix ql lc panel.png|750px|none|left|STIX quick-look light curve panel]] | [[File:Stix ql lc panel.png|750px|none|left|STIX quick-look light curve panel]] | ||
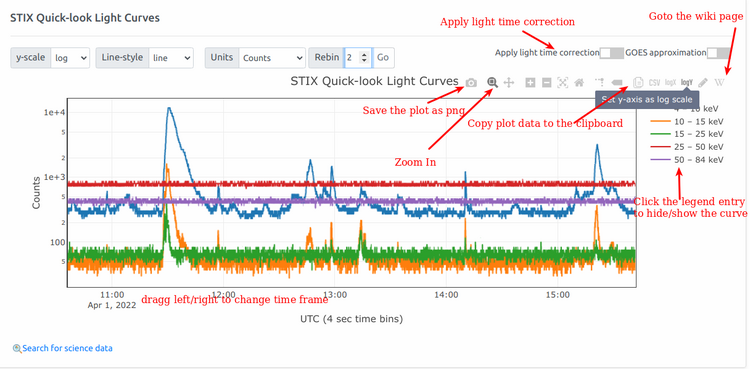
| − | STIX quick-look light curves represent time series of counts summed by the detector in five energy bands, with a default integration time of 4 seconds. | + | STIX quick-look light curves represent time series of counts summed by the detector in five energy bands, with a default integration time of 4 seconds. <br> The counts have not been adjusted for dead time, transmission, attenuator effects, or rate control regimes. The quick-look light curve data from STIX is transmitted to the ground along with other low-latency data. <br> |
| − | |||
| − | The quick-look light curve data from STIX is transmitted to the ground along with other low-latency data. | ||
Generally, these data are received by STIX data centers within a timeframe ranging from tens of minutes to two days after their generation on board. | Generally, these data are received by STIX data centers within a timeframe ranging from tens of minutes to two days after their generation on board. | ||
Latest revision as of 13:27, 15 August 2023
1 STIX Quick-look data browser
This page allows plotting STIX quick-look data and displaying simultaneous observations of external instruments.
1.1 STIX Quick-look Light Curves
STIX quick-look light curves represent time series of counts summed by the detector in five energy bands, with a default integration time of 4 seconds.
The counts have not been adjusted for dead time, transmission, attenuator effects, or rate control regimes. The quick-look light curve data from STIX is transmitted to the ground along with other low-latency data.
Generally, these data are received by STIX data centers within a timeframe ranging from tens of minutes to two days after their generation on board.
1.2 Reproduce STIX quick-look plots on your computer
Quick-look plots can be reproduced on your computer using stixdcpy
